
- Value Chain Excellence
- Company Business Performance
- Supply Chain Performance
- Supply Chain Strategy
- Integrated business management (S&OP)
- Digital Transformation
- Operational Improvement
- Transparency
- Complexity
- Agility
- Responsiveness
- Customer Needs
- Delivery Reliability
- SC Segmentation
- Inventory optimization
- Throughput Times
- Order Management
- Planning Excellence
- Cost management
- Logistics Cost
- Working Capital Optimization
- Supplier Optimization
- Transport Optimization
- Network Optimization
- Post Merger Integration


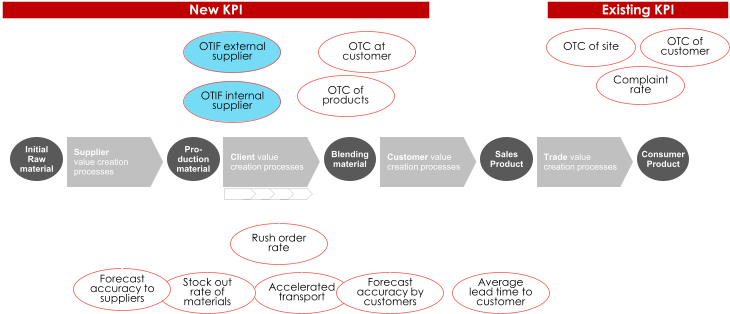
TRANSPARENCY MANAGEMENT
Transparency starts with a good set of
metrics, but needs correct information in
real time
•
Transparency into operations requires
quantitative performance
measurements. This is just given by the
size, complexity, and speen in which
the company ticks.
•
The art of KPI and metrics is not to be
underestimated. Most companies still
stick with a set of traditional metrics
they consider to be KPI.
•
But the real power is in understanding
which topic need management
attention, and how to best generate
insights into them, and to provide
focus.
•
Besides measuring the right metrics, a
lot of creativity, combined with IT tool
capabilities, can deliver new, and
often high impact insights into the
current situation of the operations.
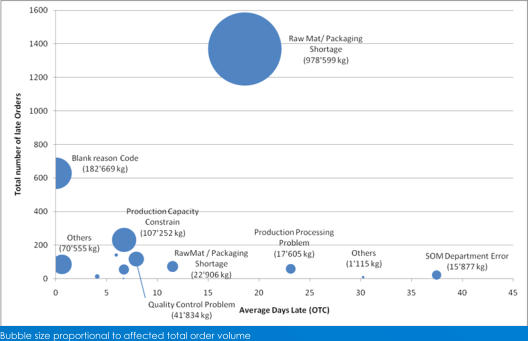
•
The example on the left shows a
combination of two metrics in a
portfolio type exhibit, which leads to
clear positioning of improvement
activities.
•
Big Data is often expected to deliver
new insights. But the key is to identify
the main issue area, and how to apply
targeted, revealing measurements in
the right way.
•
Please contact us if you want to learn
more about our methods to improve
transparency in your supply chain.